SHORTS
Quick Backtest Insights
Bite-sized backtest results in under 60 seconds. The key takeaway from our full-length videos, distilled into quick, shareable clips.
79 shorts

SHORT
98.6% Win Rate - ONE Loss in 5 Years

SHORT
The #1 Strategy Made $470,000

SHORT
$15 Wins vs $200 Losses

SHORT
30% Win Rate BEAT 50% Win Rate

SHORT
68 Strategies Tested - 28 LOST Money

SHORT
Sell Premium = Free Money?

SHORT
60% Win Rate STILL LOST $10,000

SHORT
93% Win Rate... But There's a Catch

SHORT
25 Delta vs 30 Delta: $334 Difference

SHORT
I Tested a VIEWER'S Strategy

SHORT
Why Traders Fail: Chasing Win Rate

SHORT
Why RSI-2 Fails on Some Stocks

SHORT
Top 10 Strategies Ranked

SHORT
Calendar Spreads: 91% vs 70% Win Rate

SHORT
The One Trade That Lost $8,000

SHORT
Simple Beats Complex (The Data)

SHORT
$73,000 on ONE Stock with RSI-2

SHORT
The 1:3.3 Ratio That Changed Everything

SHORT
Butterflies: 0% Win Rate
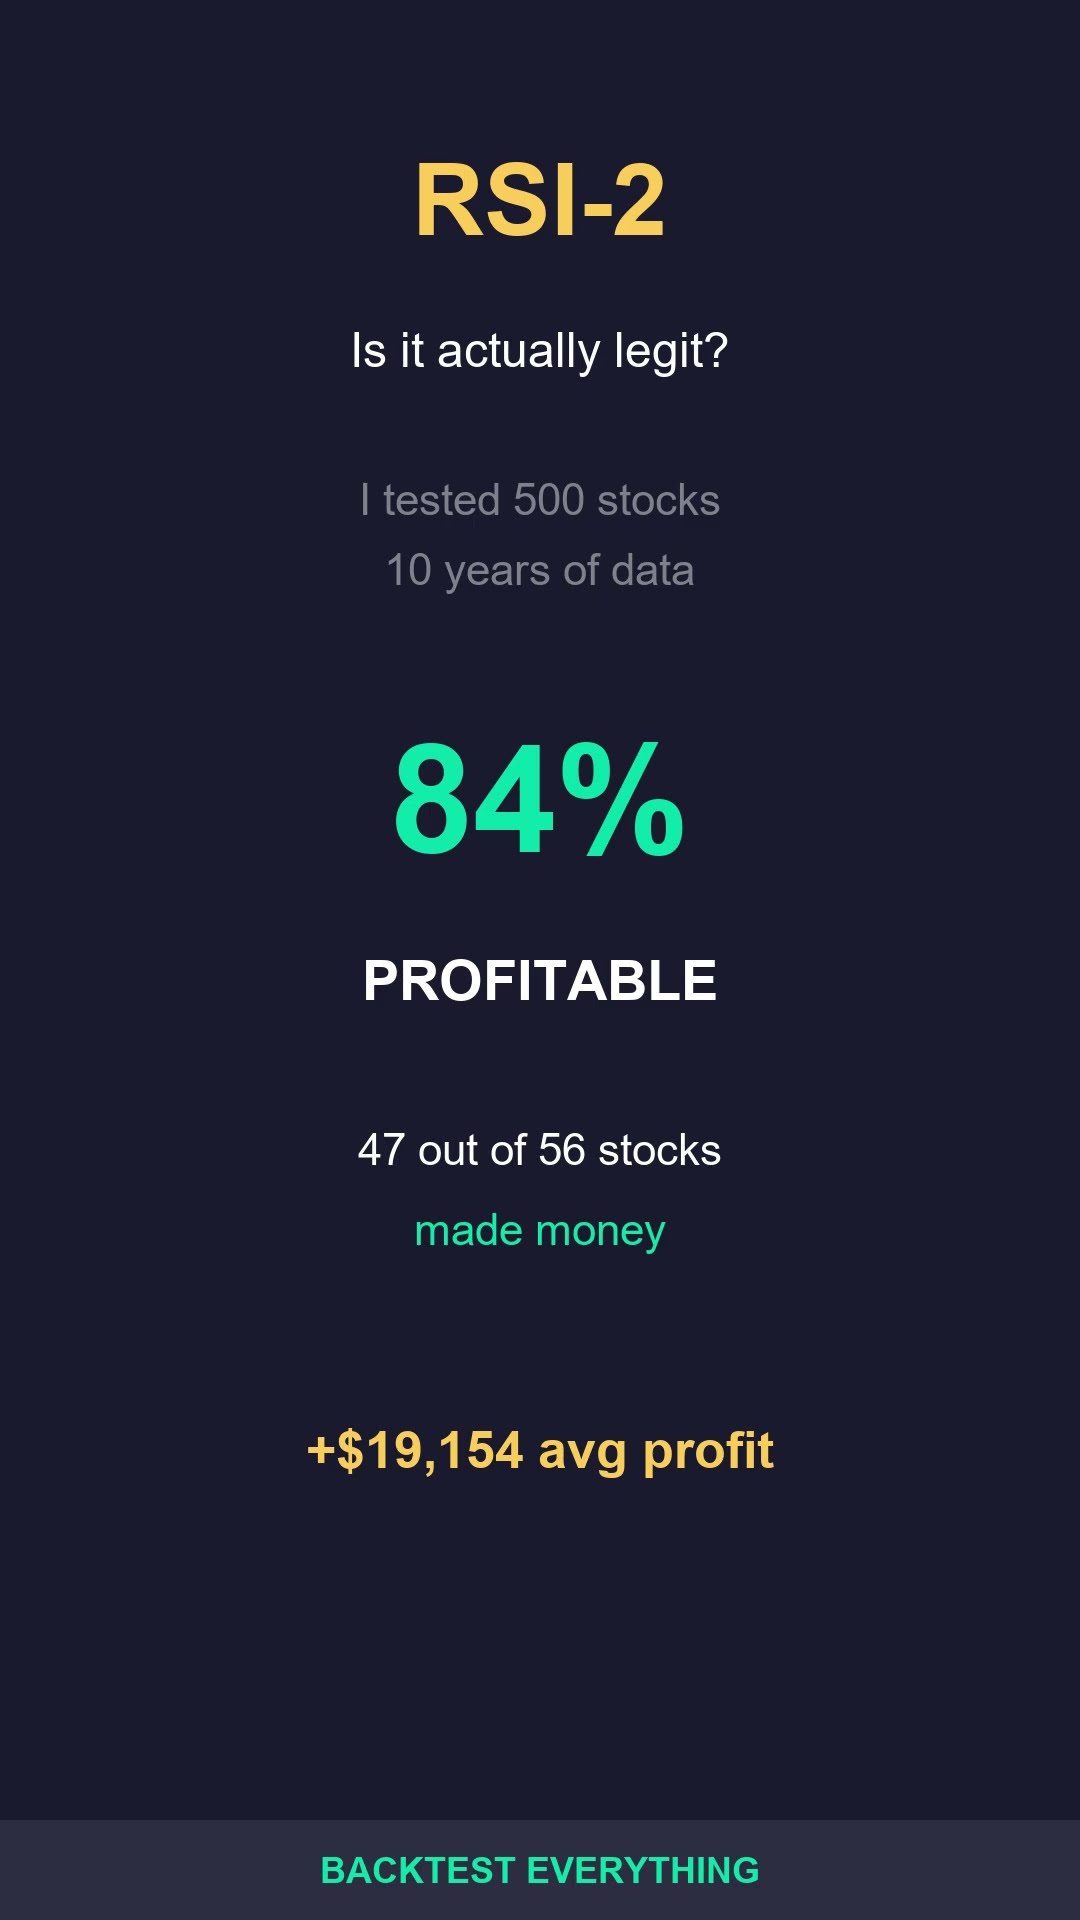
SHORT
RSI-2: 84% of Stocks Profitable

SHORT
This Strategy Beat Iron Condors by $3,000

SHORT
Stop Losses KILLED Profits 60%

SHORT
When to Use a Collar

SHORT
Collar vs Buy & Hold Crash Test

SHORT
Zero Cost Stock Protection
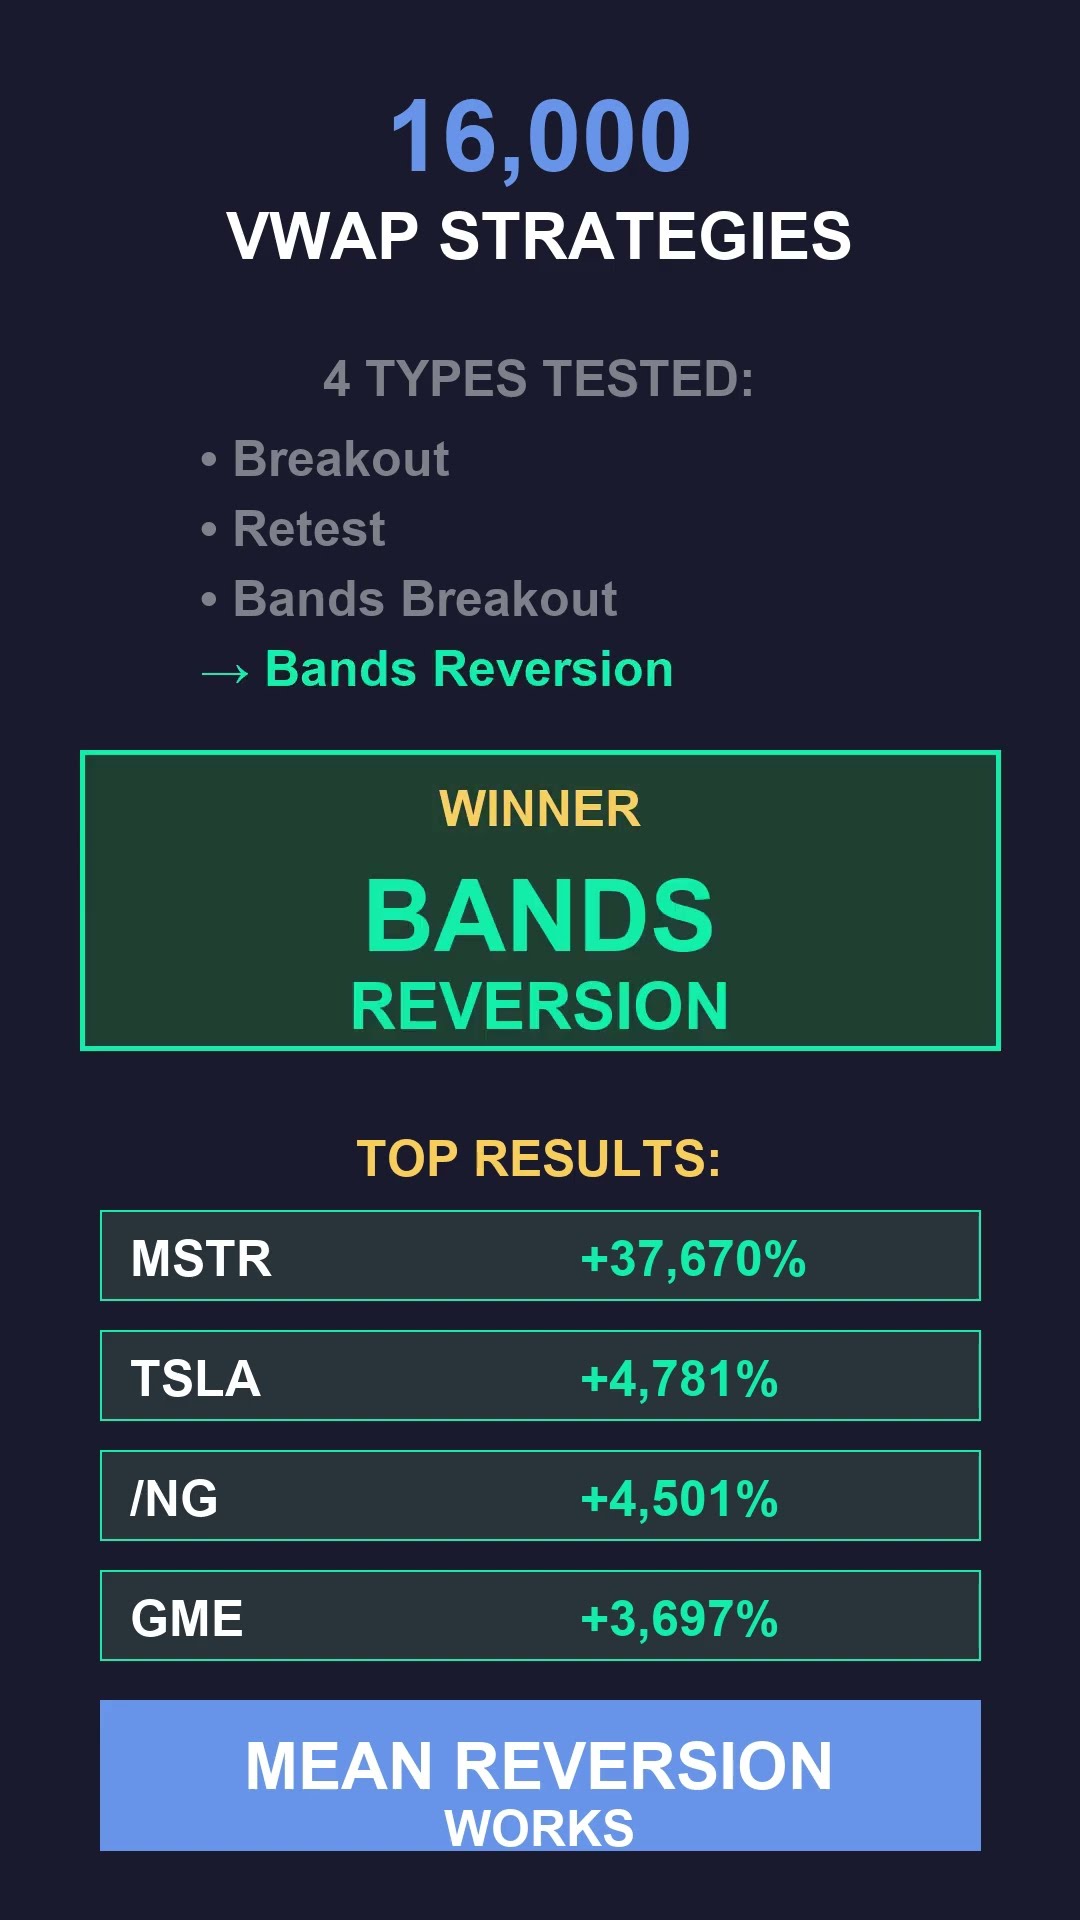
SHORT
The VWAP Strategy That Beats Everything

SHORT
1 DTE vs 30 DTE $28K Difference

SHORT
The Win Rate Trap Explained
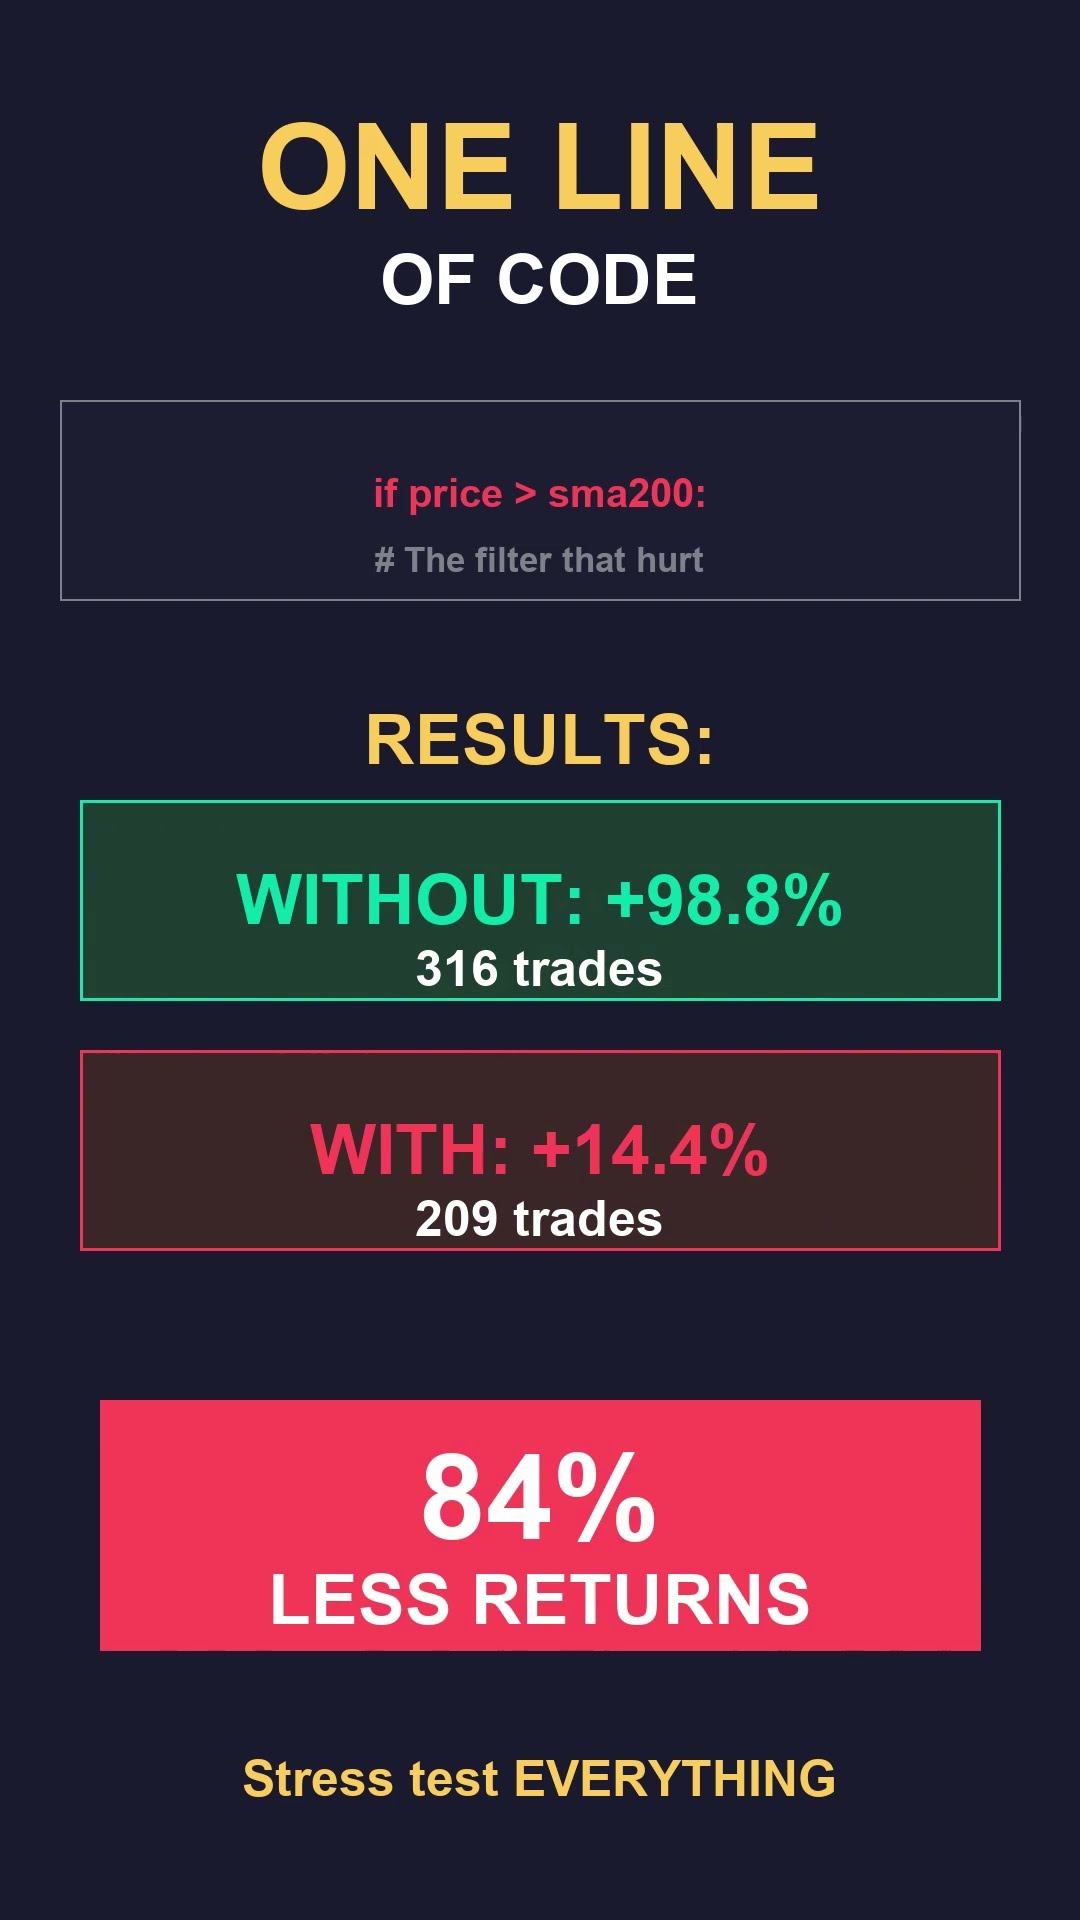
SHORT
One Line of Code KILLED My Returns

SHORT
RSI-2 in a BEAR MARKET

SHORT
I Was WRONG About RSI-2

SHORT
Deep OTM LEAPS Are NOT Lottery Tickets

SHORT
Why Volatile Stocks CRUSH Everything Else

SHORT
1 DTE Options Lost $12,099 - It's Gambling

SHORT
Your 80% Win Rate Means NOTHING

SHORT
The BEST Moving Average Combo (25,000 Tested)

SHORT
High Premium Options Are a TRAP

SHORT
6 Options Rules From 20 Backtests

SHORT
5 Options Strategies That Lost $83,000

SHORT
The OPTIMAL Options Strategy

SHORT
14/45 Calendar Spread Secret
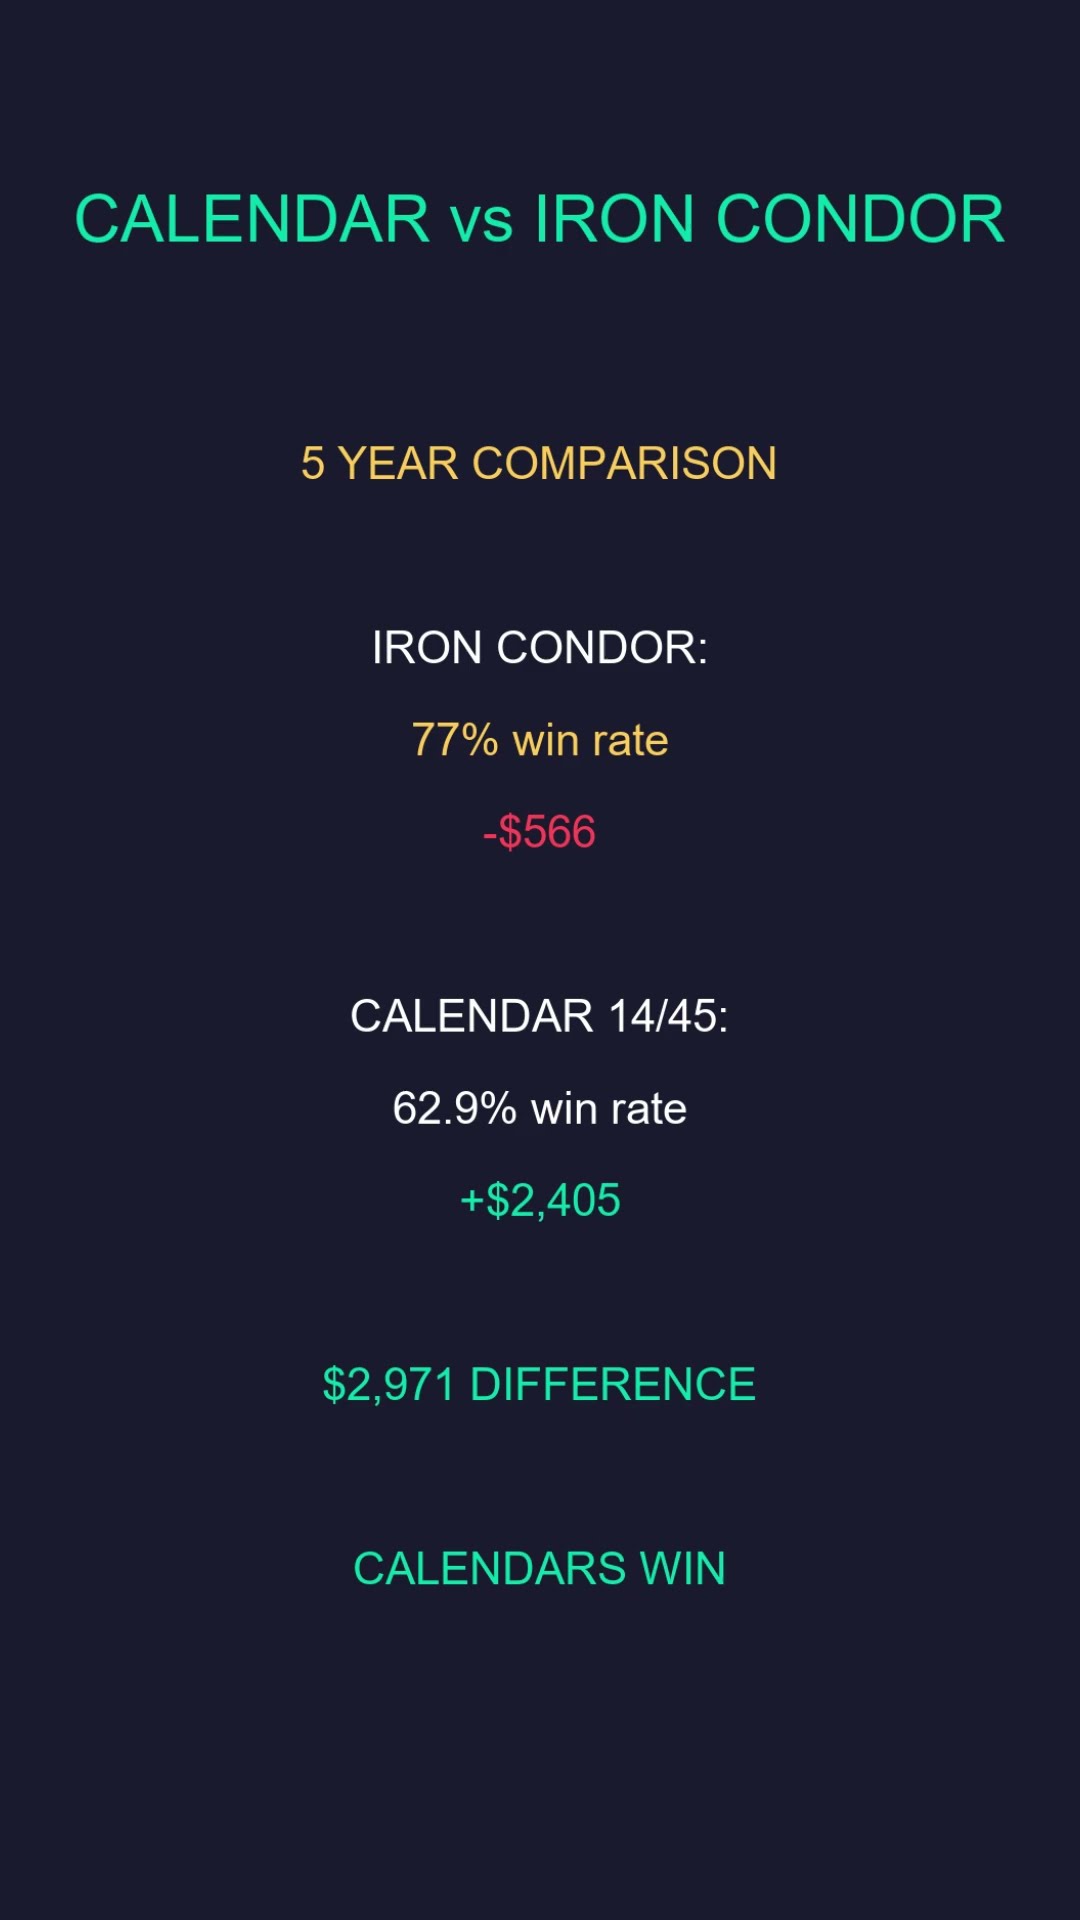
SHORT
Calendars Beat Iron Condors by $3,000

SHORT
Calendar Spreads ACTUALLY Work

SHORT
Butterfly vs Iron Condor - 5 Year Comparison

SHORT
TSLA Lost $20,135 While SPY Lost Only $566

SHORT
I Tested Buy the Dip When Smart Money is Buying

SHORT
I Tested a Viewer's Iron Condor Strategy

SHORT
The Best Butterfly Spread Config

SHORT
I Tested Butterfly Spreads for 5 Years

SHORT
TSLA Options Lost Me $20,000

SHORT
Cash Secured Put Assignment Rates

SHORT
Best Delta for Cash Secured Puts

SHORT
86% Win Rate Selling Options

SHORT
Straddles vs Strangles - 5 Year Backtest

SHORT
Why Straddles Underperform Strangles

SHORT
80% Less Capital - PMCC Explained

SHORT
The Truth About Poor Man's Covered Calls

SHORT
87% Win Rate and Still LOST $28,000

SHORT
Best Delta for the Wheel Strategy

SHORT
Wheel Strategy vs Buy & Hold - Which Wins?

SHORT
I Backtested the Wheel Strategy for 5 Years

SHORT
The #1 Rule for Trading Options During Earnings

SHORT
$11,628 Profit on NVIDIA Earnings

SHORT
LOW VIX = SAFE? WRONG.

SHORT
86% Win Rate on Iron Condors

SHORT
10 Delta vs 20 Delta - $17K Difference

SHORT
10 Losses in a ROW - February 2020

SHORT
$5,000 in FEES Destroyed My Strategy

SHORT
70% Win Rate = LOSING Strategy

SHORT
Best ETF for Iron Condors (Not SPY)

SHORT
The WORST Day to Sell Options

SHORT
Strangle Made More But Lost

SHORT
Take Profits at 50%? YES.

SHORT
Stop Losses Cut My Profits 60%

SHORT
Calls vs Puts

SHORT
QQQ Destroyed My Iron Condors

SHORT
1 DTE vs 30 DTE - $28K Difference
SHORT
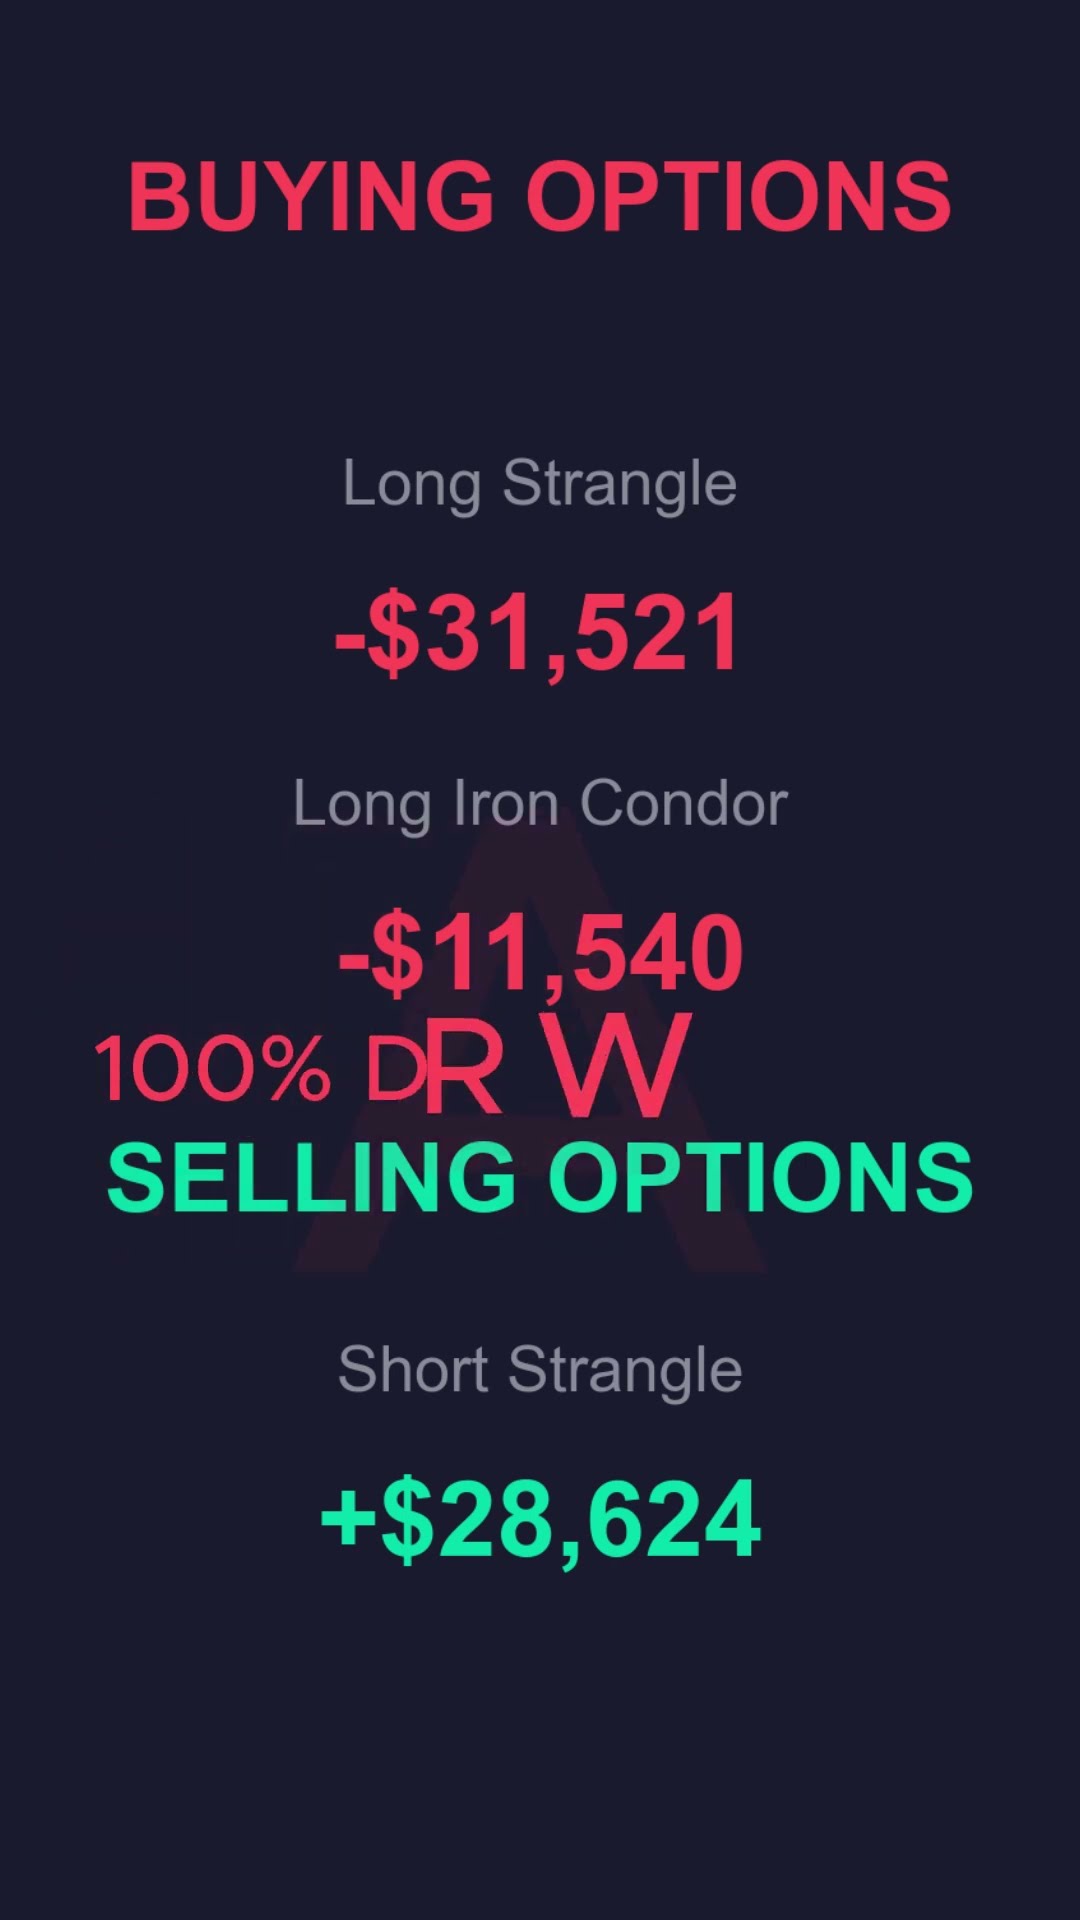
Buying Options = 100% Drawdown

SHORT